Local Outlier Factor
Local outlier Factor (LoF) is another density based approach to identify outliers in a dataset. The LoF is applicable to identify outliers in a dataset, which has a mixture of data distributions.
[caption id="attachment_912" align="aligncenter" width="318"]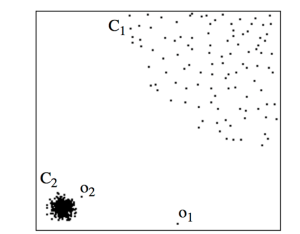 Figure showing the dense and sparse distribution of points [Source: Google images][/caption]The above figure shows two different distributions, a dense cluster of points and a sparse distribution of points. In such datasets, for each specific distribution within a dataset, we should perform outlier detection locally, i.e., points within one distribution should not affect outlier detection in another cluster. The LoF algorithm follows the same intuition and calculates anomaly score for each point within a distribution as:
- For each data point $latex X $, let $latex D^k(X) $ represent distance of point $latex X $ to its $latex k^{th} $ neighbor, and $latex L_{k}(X) $ represent set of points within $latex D^k(X) $
- Compute reachability distance for each data point, $latex X $ as $latex R_{k}(X, Y) = max(dist(X,Y), D^k(Y)) $
- Compute Average reachability distance $latex AR_{k}(X)$ of data point $latex X$ as $latex AR_{k}(X) = MEAN_{Y \in L_{k}(X)} R_{k}(X, Y) $
- In the final step, LOF score for each point, $latex X $ is calculated as: $latex LOF_{k}(X) = MEAN_{Y \in L_{k}(X)} \frac{AR_{k}(X)}{AR_{k}(Y)} $
To find the best value of $latex k $, it is always good to follow ensemble approach, i.e., use a range of $latex k $ values to calculate LOF scores and then use a specific method to combine the outlier scores.
References:
- Book: Outlier Analysis by Charu Aggarwal
- Wikipedia
- Google Images