Area Under the Curve (AUC): A performance metric
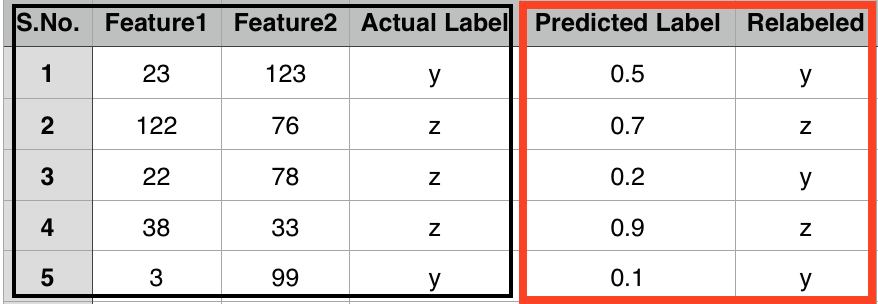
Consider a scenario where we have observations defined by the associated attributes. Further, assume that we know the actual class label of each observation as shown in below figure. [Note: this data is random and there is no relation between I/O]

Mostly, classifiers predict output in the form of categorical labels, but there are instances where a classifier outputs final result in the form of a score, say a score in the range of [0, 1]. The above snapshot figure shows such a instance, where our classifier predicts output in the form of a score (shown in predicted Label column).
Till this, everything is ok, but the question is how can we compute the performance of such classifiers. I mean, well-known metrics like precision and recall are impossible to compute for such scenarios! Although, humans can attach meaning to theses numbers/score, say we consider a threshold value on predicted label, and the values higher than the threshold are labelled as Z and the values below the threshold are labelled as Y. On assuming a threshold of 0.8, we get something like this
Now, we have categorical labels both in the prediction column and in actual label column. Is it fair now to compute metrics like precision and recall ? Wait, we might get different results for precision and recall if we consider different threshold. Now, it is really troublesome to compute existing well-known metrics for these type of scenarios.
For such type of scenarios, we use another metric known as Area Under the Curve (AUC). The curve is known by the name of Receiver Operating Characteristics (ROC). The ROC curves corresponding to four (A, B, C, and D) different classifiers/methods are shown in below figure as
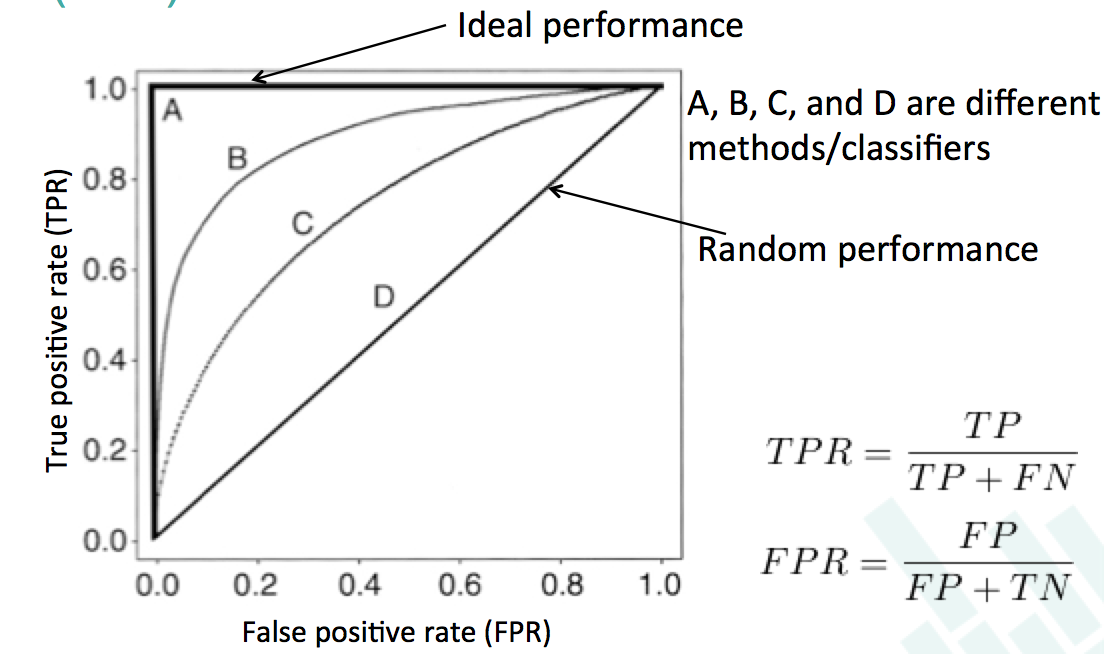
The true positive rate (TPR) give information about correctly identified instances while as false positive rate (FPR) gives information about misclassified instances. The ideal ROC curve have a TPR of 1 and FPR of 0. To extract the meaningful information from these ROC curves, we use AUC value which represents the area under the considered ROC curve. The AUC value ranges between [0, 1]. A value of 1 represents ideal/perfect performance and value of 0.5 represents random (50/50) performance.
The AUC value is computed at various thresholds. So, we can say that the final AUC value is not biased by a single threshold.