Intuitive meaning of k range in Local Outlier Factor (LOF)
The Local Outlier Factor (LOF) is a well-known outlier detection algorithm. In the previous post, I noted down the steps of LOF and here I will discuss its k parameter. The k parameter often lands the users of LOF into difficulty, but while looking at the meaning of k parameter and the respective application domain, I find it is easy to select a k range. The authors of LOF suggest to use a range of k values instead of using a selective value. This is because we cannot generalise a particular value of k over various datasets following diverse underlying data distributions. Now, let us understand how to select lower (lwrval) and upper (uprval) values of the k range.
To explain it further, let us consider a simple scenario shown in below figure
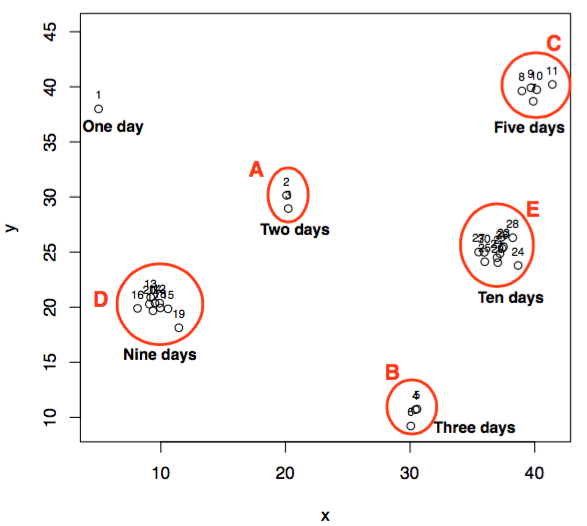
This figure shows the energy consumption of some imaginary home for one month (30 days). Each small circle represents energy consumption of a particular day, where a number above the circle shows the corresponding day of the month. Nearby circles marked within red clusters (A, B, C, D, E) represent days that follow a similar pattern in energy consumption as compared to remaining days.
To use LOF on such a dataset, we need to set the range of k values instead of a single k value. Note that lwrval and uprval are domain dependent. According to LOF paper, lwrval and uprval are defined as:
- lwrval: This refers to the minimal cluster size which consists of similar behaving points, and we believe this similarity is not due to some random cause. This means that we assume a cluster with a size lower than lwrval represent outliers. For example, if I consider lwrval = 3, then clusters A and B represent outliers because none of the points within these clusters has three more similar points/neighbours. At the same time, points within clusters C, D, and E represent normal points because each of them has three more like neighbours.
- uprval: This suggests to the upper optimal number of points to be similar. In other words, we believe that uprval number of points must be similar in the considered application domain. For example, In the energy domain, I know that at least for 6 days (working days of a week) energy consumption is similar due to the occupancy behaviour. So, I set the uprval = 6. No doubt there can be a cluster with size greater than uprval, but our reasoning on a specific dataset motivates us for some optimal uprval. Consider an another example where we assume that occupants of a home change on a weekly basis - say there were 5, 10, 15, and 20 occupants on the first, second, third and fourth week of a month respectively. Consequently, the energy consumption on four different weeks should be similar intra-week and different inter-week. This example suggests that we should get four clusters corresponding to four weeks and the size of each cluster should be 7 (number of weekdays). So, our uprval is 7 in this example.
I believe now lwrval and uprval limits can be easily interpreted for any application domain. Therefore, according to original LOF paper now we can calculate LOF outlier values on a set of k values defined by lwrval and uprval. In the next post, I will explain the above figure further and show how a particular k value effects outlier score.